Many of those that are familiar with the construction of a prismatic lithium-ion battery will say that it breathes. Charging and discharging causes temperature changes, electrochemistry, and mechanics of the internal components that, in turn, change the internal pressures. As manufacturers try to create a product that is efficient, lightweight, and safe, it is of paramount importance that designers intimately understand these characteristics.
Regardless of the industry, consumer electronics, or energy storage systems to name a few, users are requesting batteries that are lighter, more compact, have a higher energy density and faster charging. They must also be safe in the event of catastrophic incidents. These features can often be in conflict, it can be a challenge to find a balance and stay cost competitive.
When considering materials and construction of a battery, evaluating the pressure dynamics is critical to maintain the material spacings, control gassing, and prevent excess swelling.
What is pressure mapping?
Even between relatively flat surfaces, you might find the interface pressure distribution is often not uniform within localized areas of peak pressure. Pressure mapping technology helps design engineers obtain insight into areas that may impact design and quality.
As shown in Figure 1, pressure mapping systems are made of three components – sensors, scanning electronics, and software – to deliver real-time, actionable data, in ways other methods cannot.

- The sensor is an array of piezoresistive sensing points that measure pressure distribution over the sensing area. The sensor transforms compressive pressure loads to a change in resistance.
- Sensors typically have about 2,000 sensing points, but some sensors can be designed with over 16,000 sensing points.
- Sensing element spacing (pitch) can be as narrow as 0.64 mm (0.025 in.).
- Sensors can measure pressure ranges up to 25,000 PSI (172 MPa)
- High-temperature sensor options up to 200°C (400°F)
- The scanning electronics collect analog data from the sensor and convert the data into a digital signal.
- Scanning speeds available up to 20,000 Hz
- The software displays real-time activity of the sensor area, allowing users to see force, pressure, contact area, and timing data.
A research-supported method to measure compressive stack stress
While many manufacturers make significant efforts to maintain constant stack construction during manufacturing, many do not validate the stack pressure as part of their quality procedure. Furthermore, many do not quantify the internal stresses on the stack as the battery is charged and discharged.
In a 2013 Princeton study1, researchers found that high stack pressures had “a strong effect on long term cell performance, with higher levels of stress leading to higher rates of capacity fade.” Significant internal pressures were shown to cause plastic deformation, delamination, and internal impedance increases when the anode and cathode separate. While lower stack pressures provided better long-term performance, delamination may still occur when pressures are too low.
Finding the “sweet-spot” for housing pressure becomes a challenge. A load cell fixture can characterize the average pressure on the battery assembly. While this study was successful in measuring average pressure in cycle testing, pressure mapping technology offers engineers an opportunity to gain more insight into this application and identify specific regions of pressure.
A new model for measuring battery stack stress
The thin and flexible array of sensing elements provides comprehensive data of the different pressures between nearly any two surfaces. As in Figure 2, in the case of battery charge/discharge cycle testing, a 0.01mm thick sensor can be wrapped around the battery to provide a 360º view.
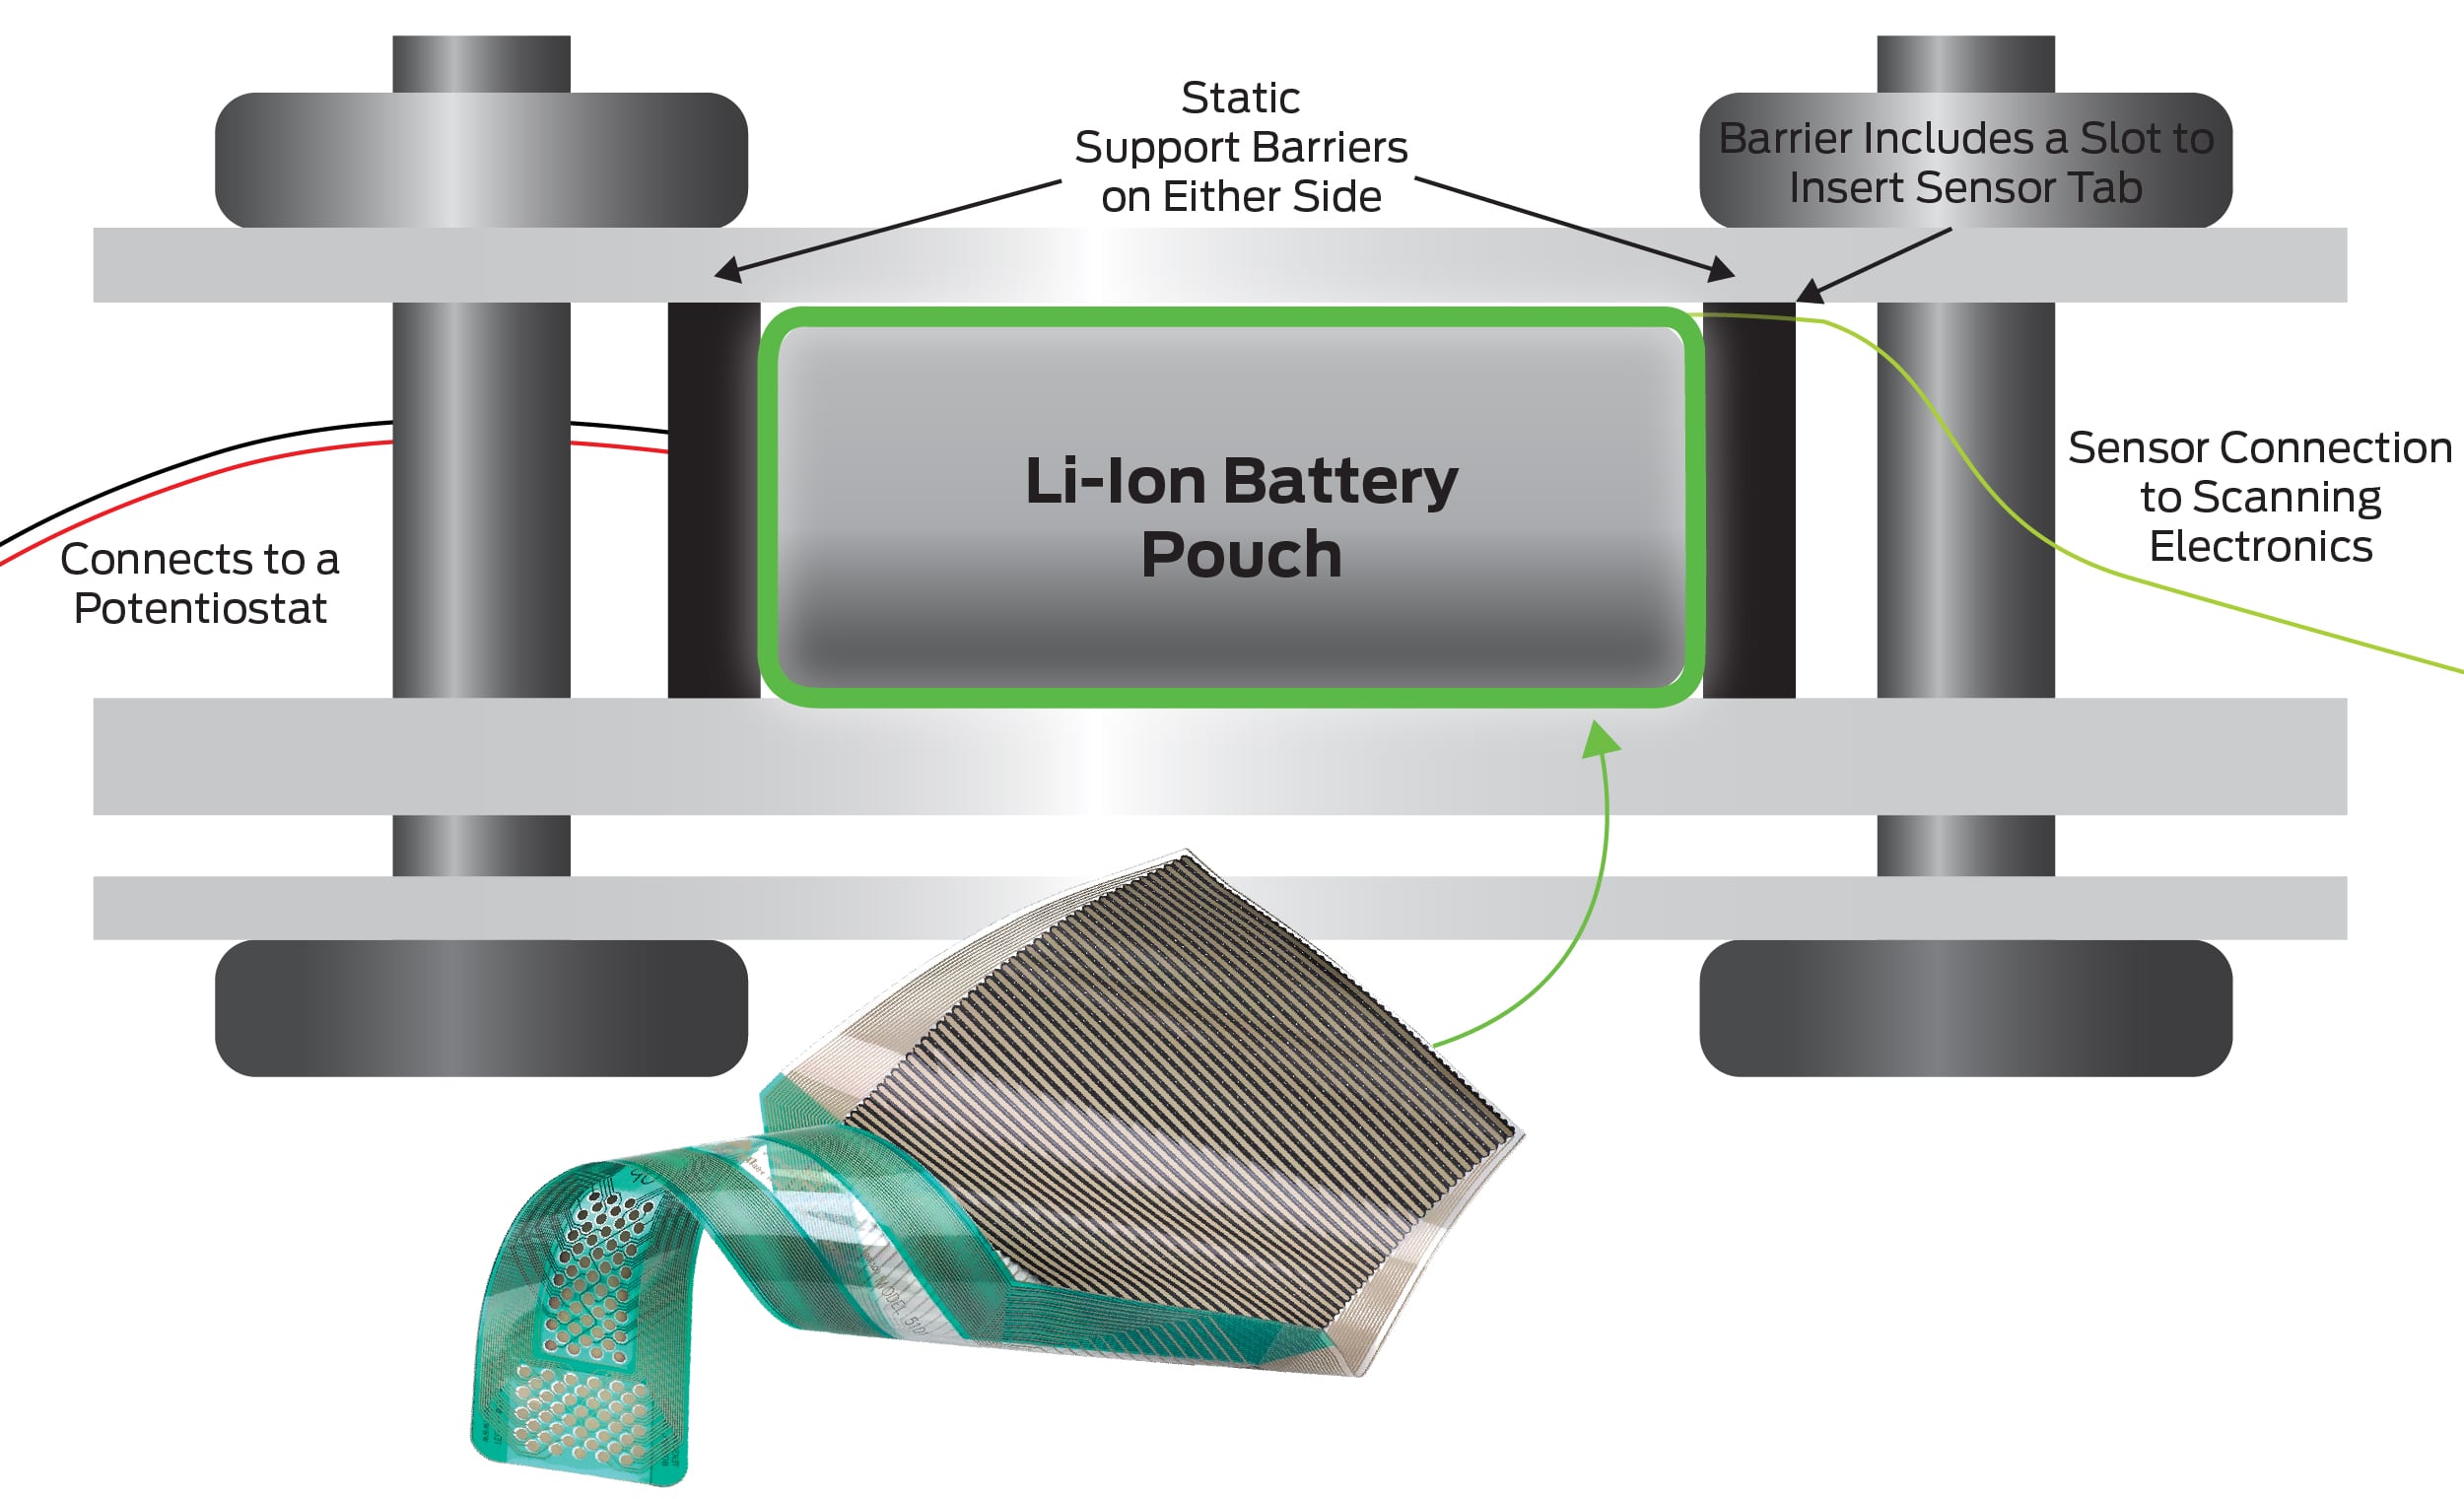 Figure 2: This model demonstrates how battery designers can use pressure mapping technology to measure pressure that occurs while charging and discharging a lithium-ion battery. The thin & flexible sensor fits snugly between nearly any fixture or battery type.
With pressure mapping, researchers and battery designers are provided with a wealth of evaluation tools and insights on the impacts of different use parameters for their designs. These studies have helped designers find the correct materials and best construction for their needs, leading to better designs with repeatable results.
Pressure mapping has been used in multi-month studies evaluating the pressure profile during thousands of charging and discharging cycles — principles that can be applied to evaluating battery housing materials.
Figure 3 shows data from a five-hour segment of a long-term battery charge/discharge cycle test. Based on these short-term results, there are clear interface pressure dynamics taking place while charging and discharging, including specific regions on the battery that displayed excessive pressure during the charging process.
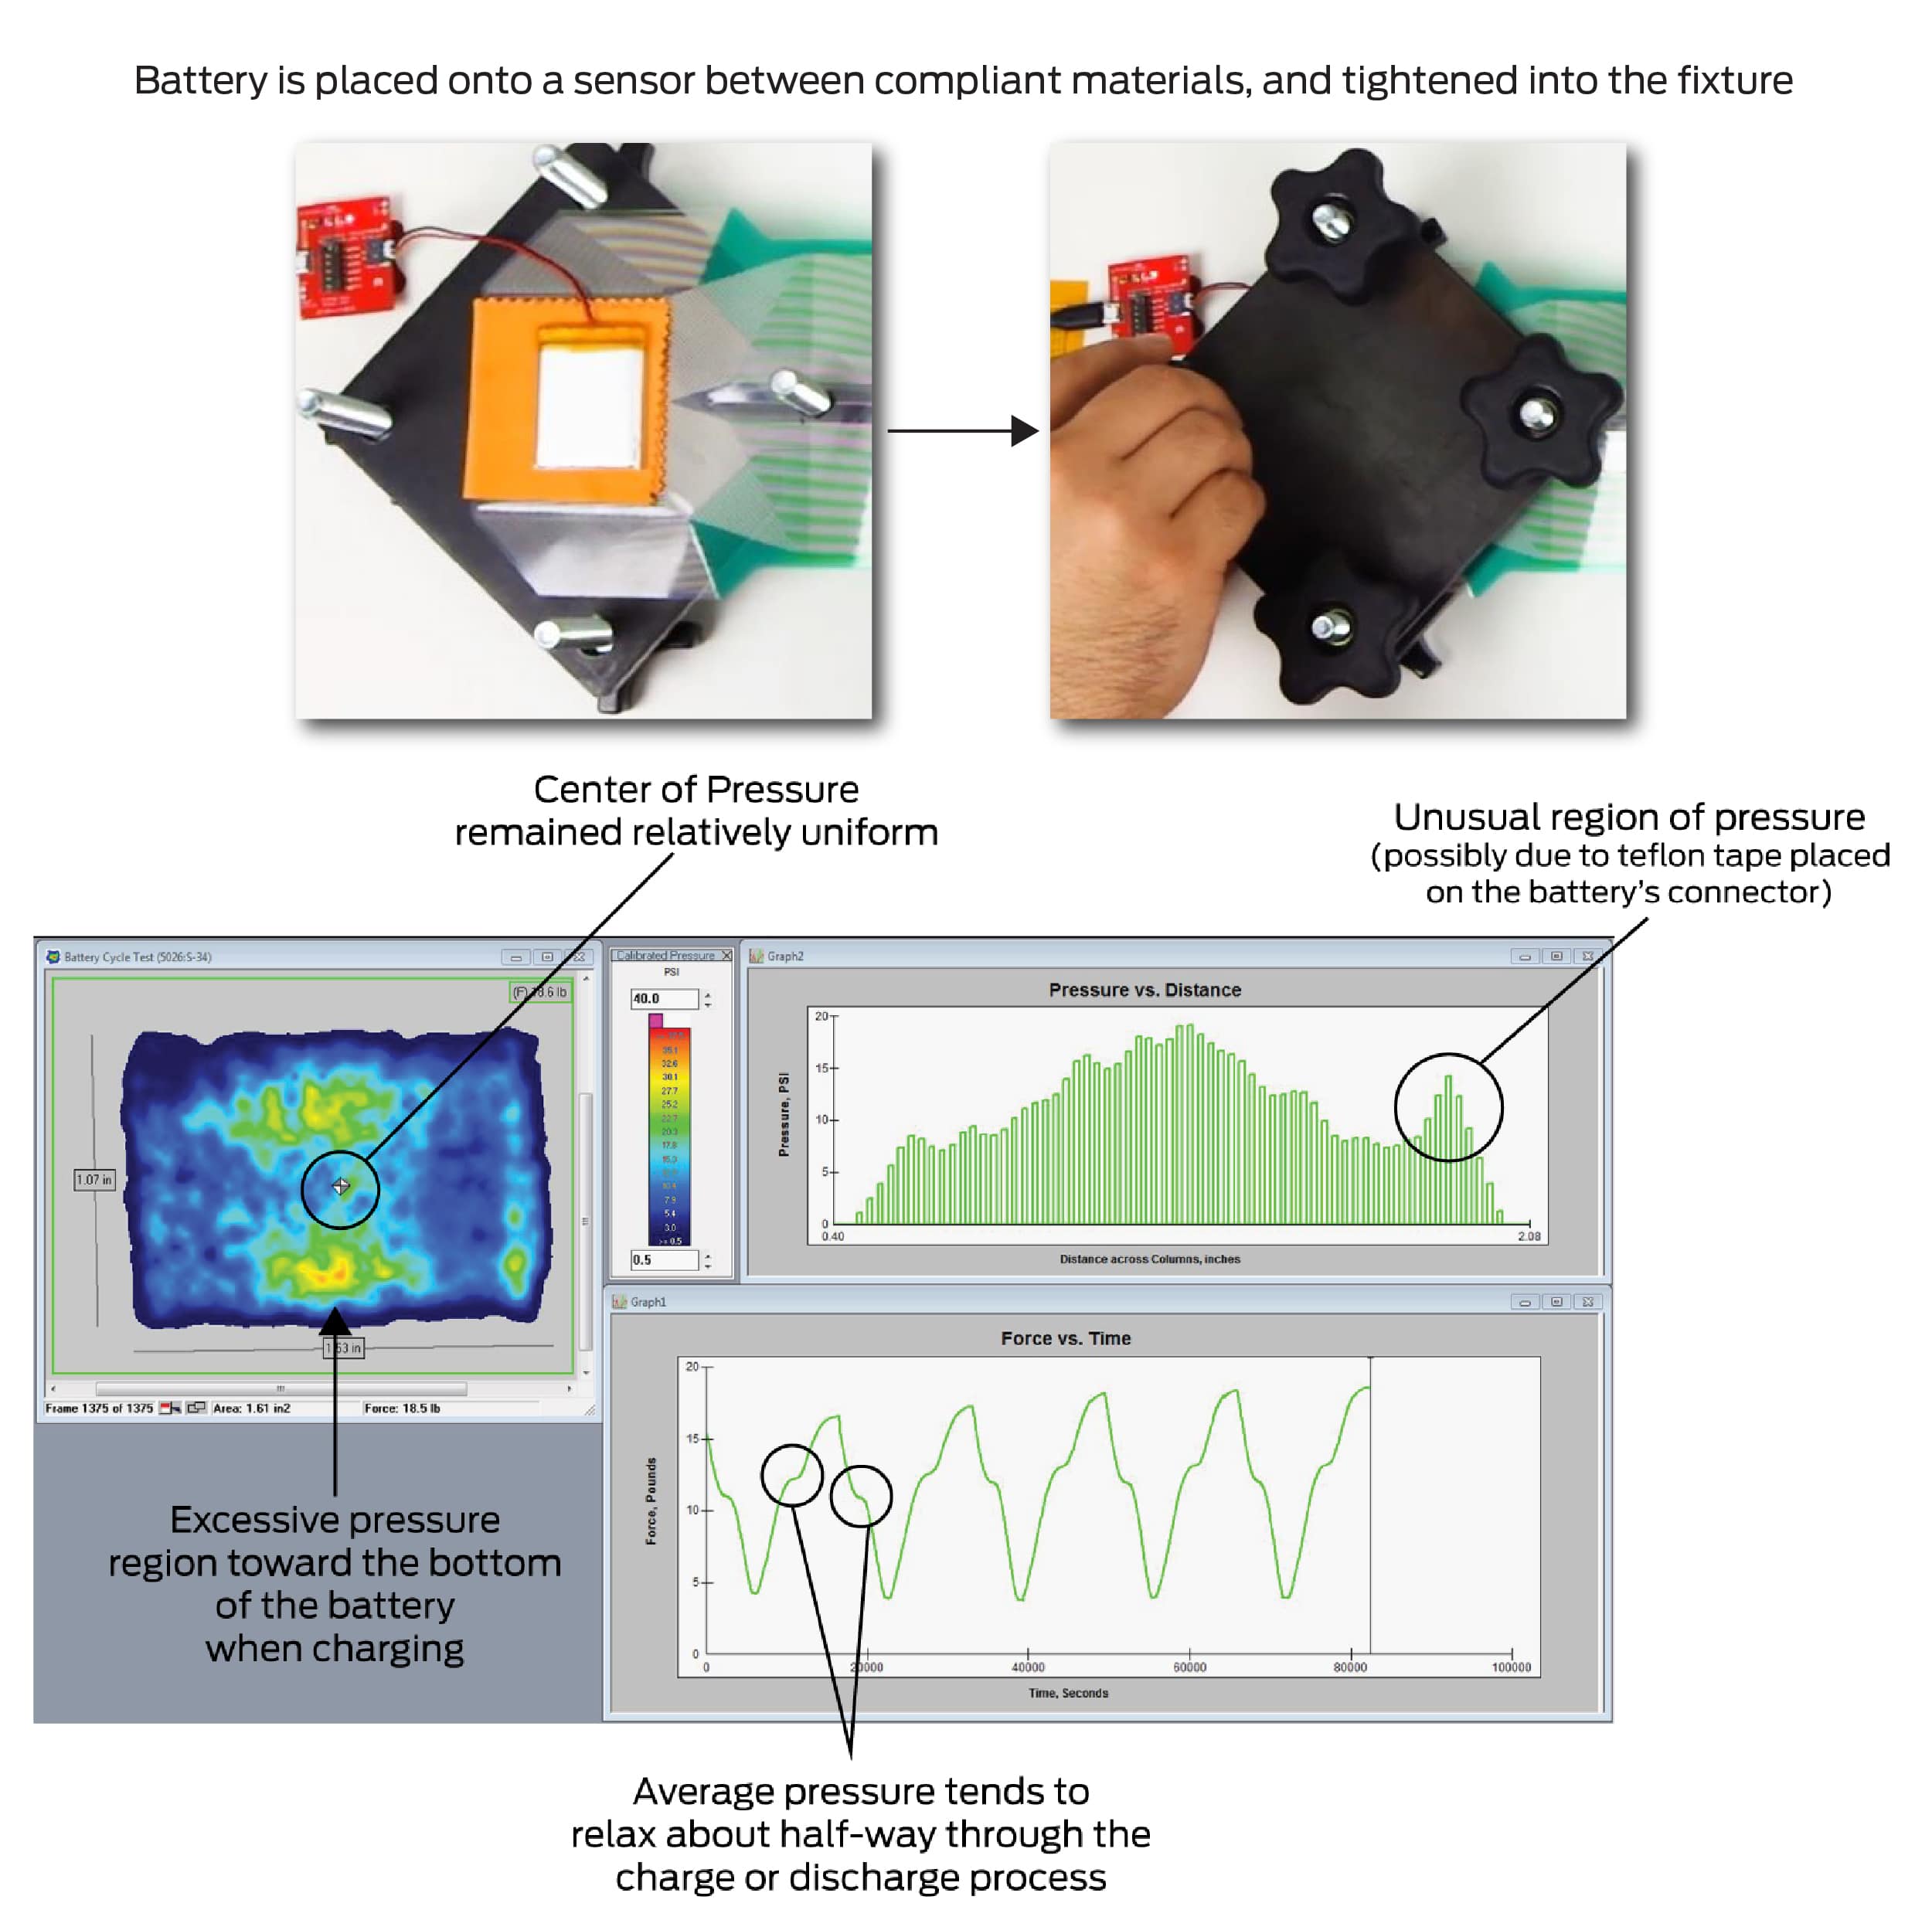 Figure 3: Example of a five-hour charge/discharge cycle test. The top two images show the battery placed in the fixture, while the screenshot shows the pressure output.
This technology has also been used to evaluate housing designs or identify vulnerable locations on a battery in impact testing.
While trying to optimize the characteristics described in this article, designers should never compromise the safety of their products. The temperature increases during charges causes lithiation, which leads to gassing. The internal pressures from the additional gasses in the battery can cause housing or separator failures, which can lead to thermal runaway reactions.
Pressure mapping technology becomes an important method to help engineers identify areas of localized pressure at virtually any position of the prismatic battery cell, leading to better design decisions and longer-lasting technology.